A Survey of Croatia’s NSDI Performance: A Task-Based Assessment
In this research project, we tackled the challenging question of "How many trees can be planted in Croatia to mitigate the urban heat island effect?" as part of Europe's ambitious 3 Billion Trees Initiative. Our work required overcoming significant obstacles related to Croatia's underdeveloped National Spatial Data Infrastructure (NSDI). The available geospatial data suffered from inconsistencies, gaps, and quality issues, forcing us to develop several workarounds and custom solutions. Through extensive data cleaning, validation, and integration efforts, we not only addressed our primary research question but also generated several valuable byproducts. These included fraction of vegetation data, sky view factor, improved municipal boundaries, ...etc. Ultimately, our methodology provides actionable data for policymakers while contributing to climate change mitigation efforts.
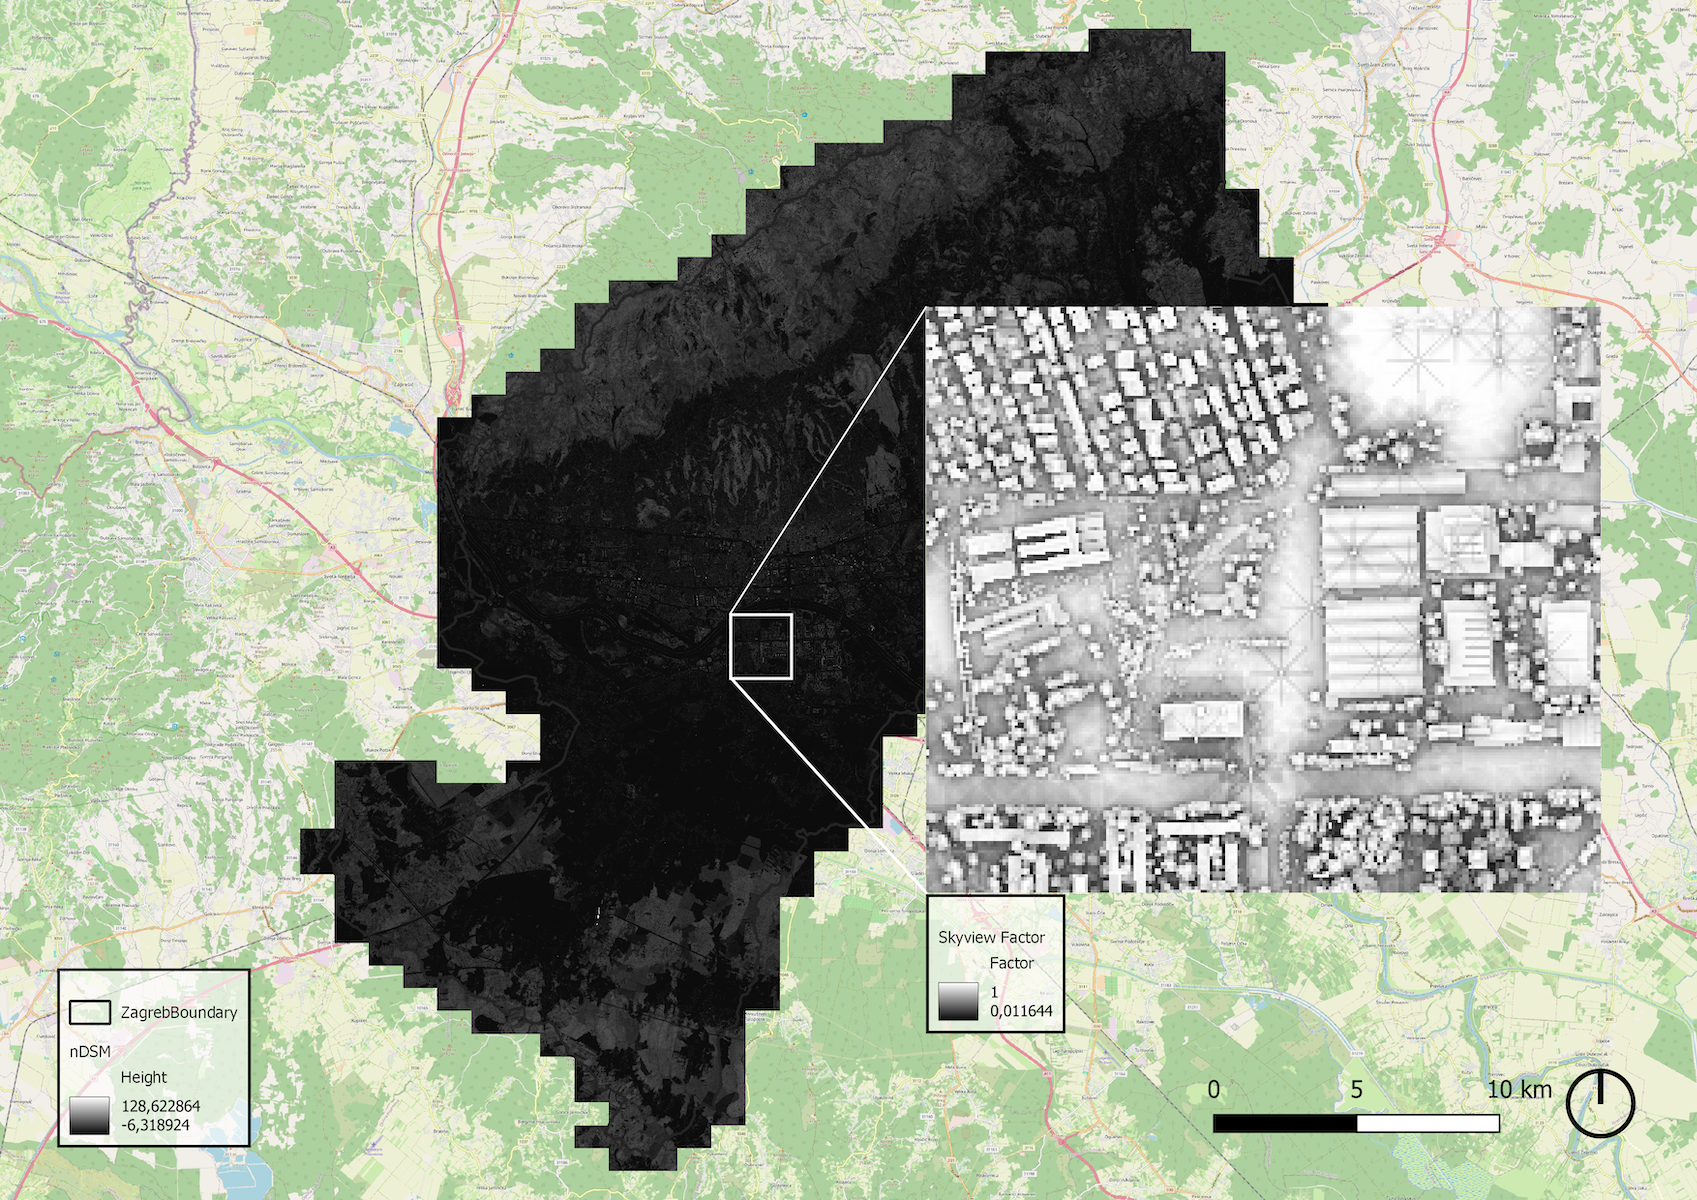
Sky View Factor
The Sky View Factor (SVF) was computed using the Terrain Shading plugin (Landscape Archaeology, 2024). This analysis was conducted on the normalized Digital Surface Model (nDSM) obtained from dgu.gov.hr. Due to time constraints, the original nDSM was rescaled to a lower resolution to optimize processing performance. The resulting SVF values, ranging from 0 to 1, are presented below, illustrating the distribution of sky visibility within the study area.
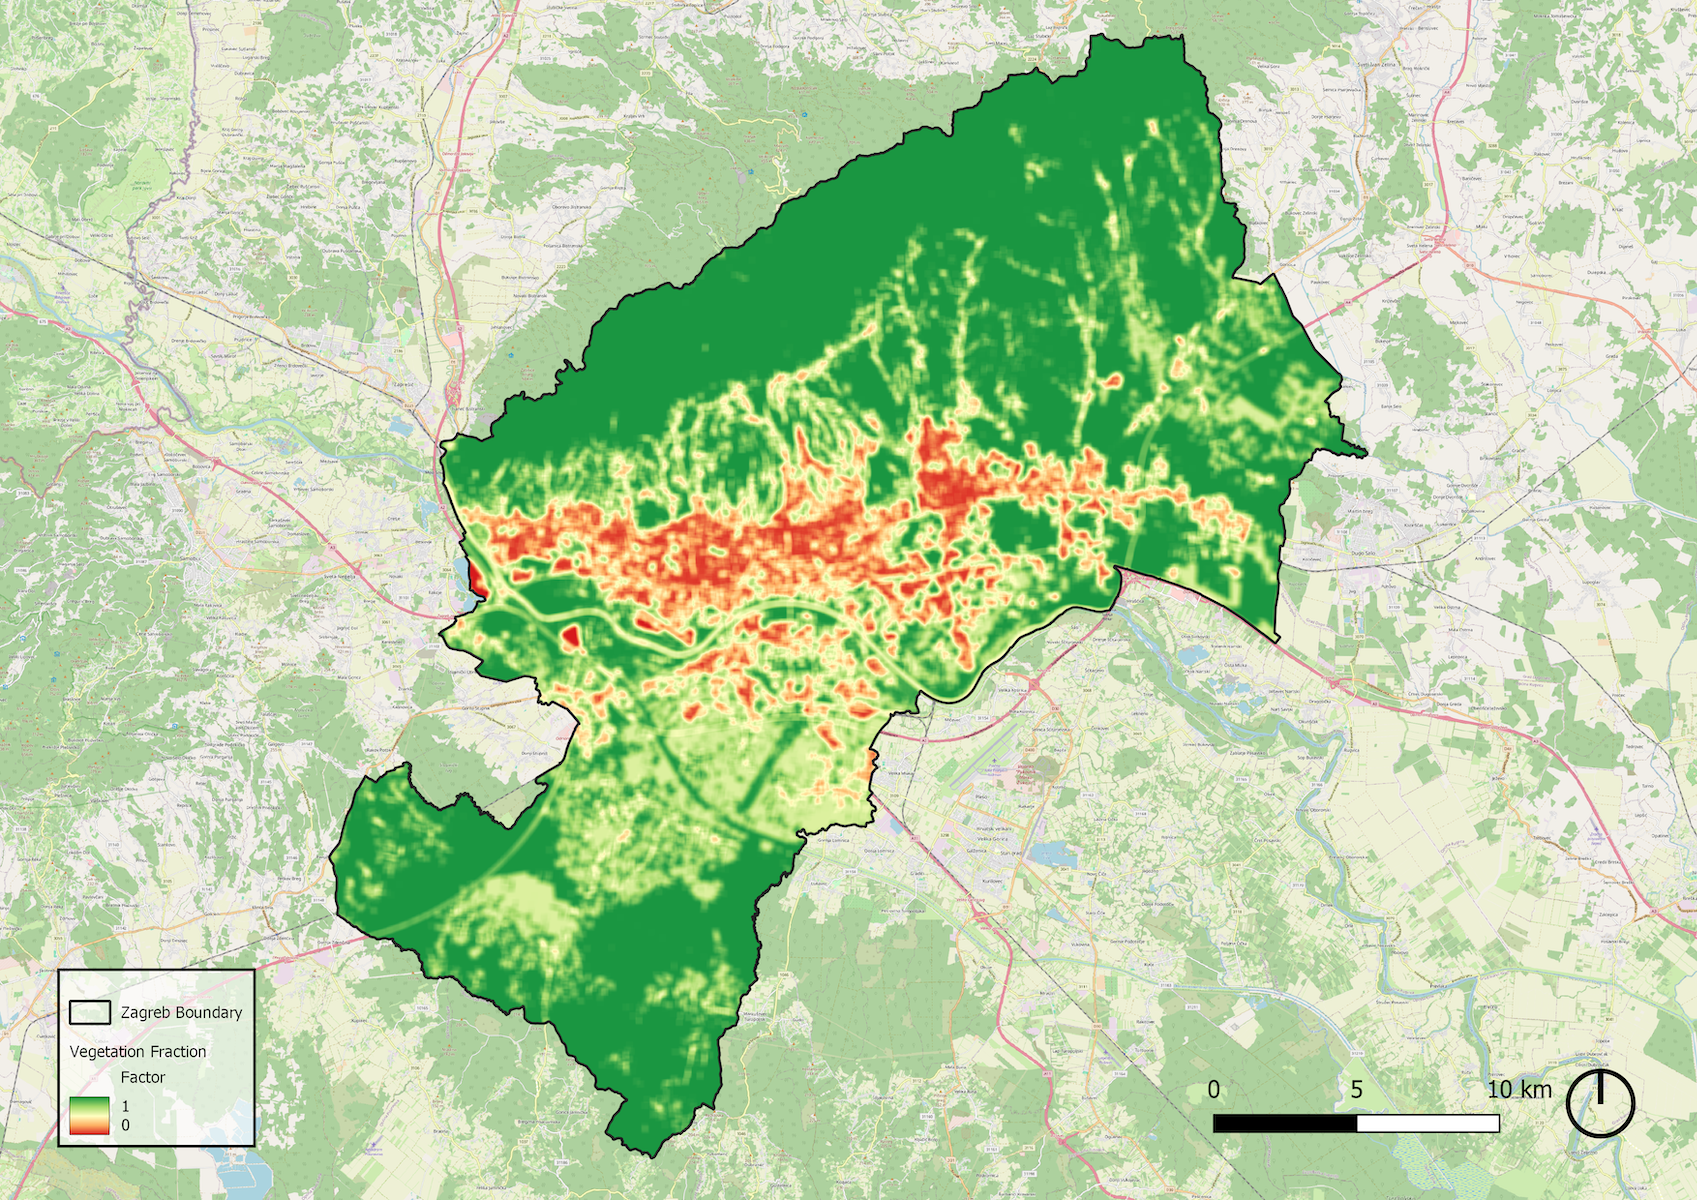
Fraction of Vegetation
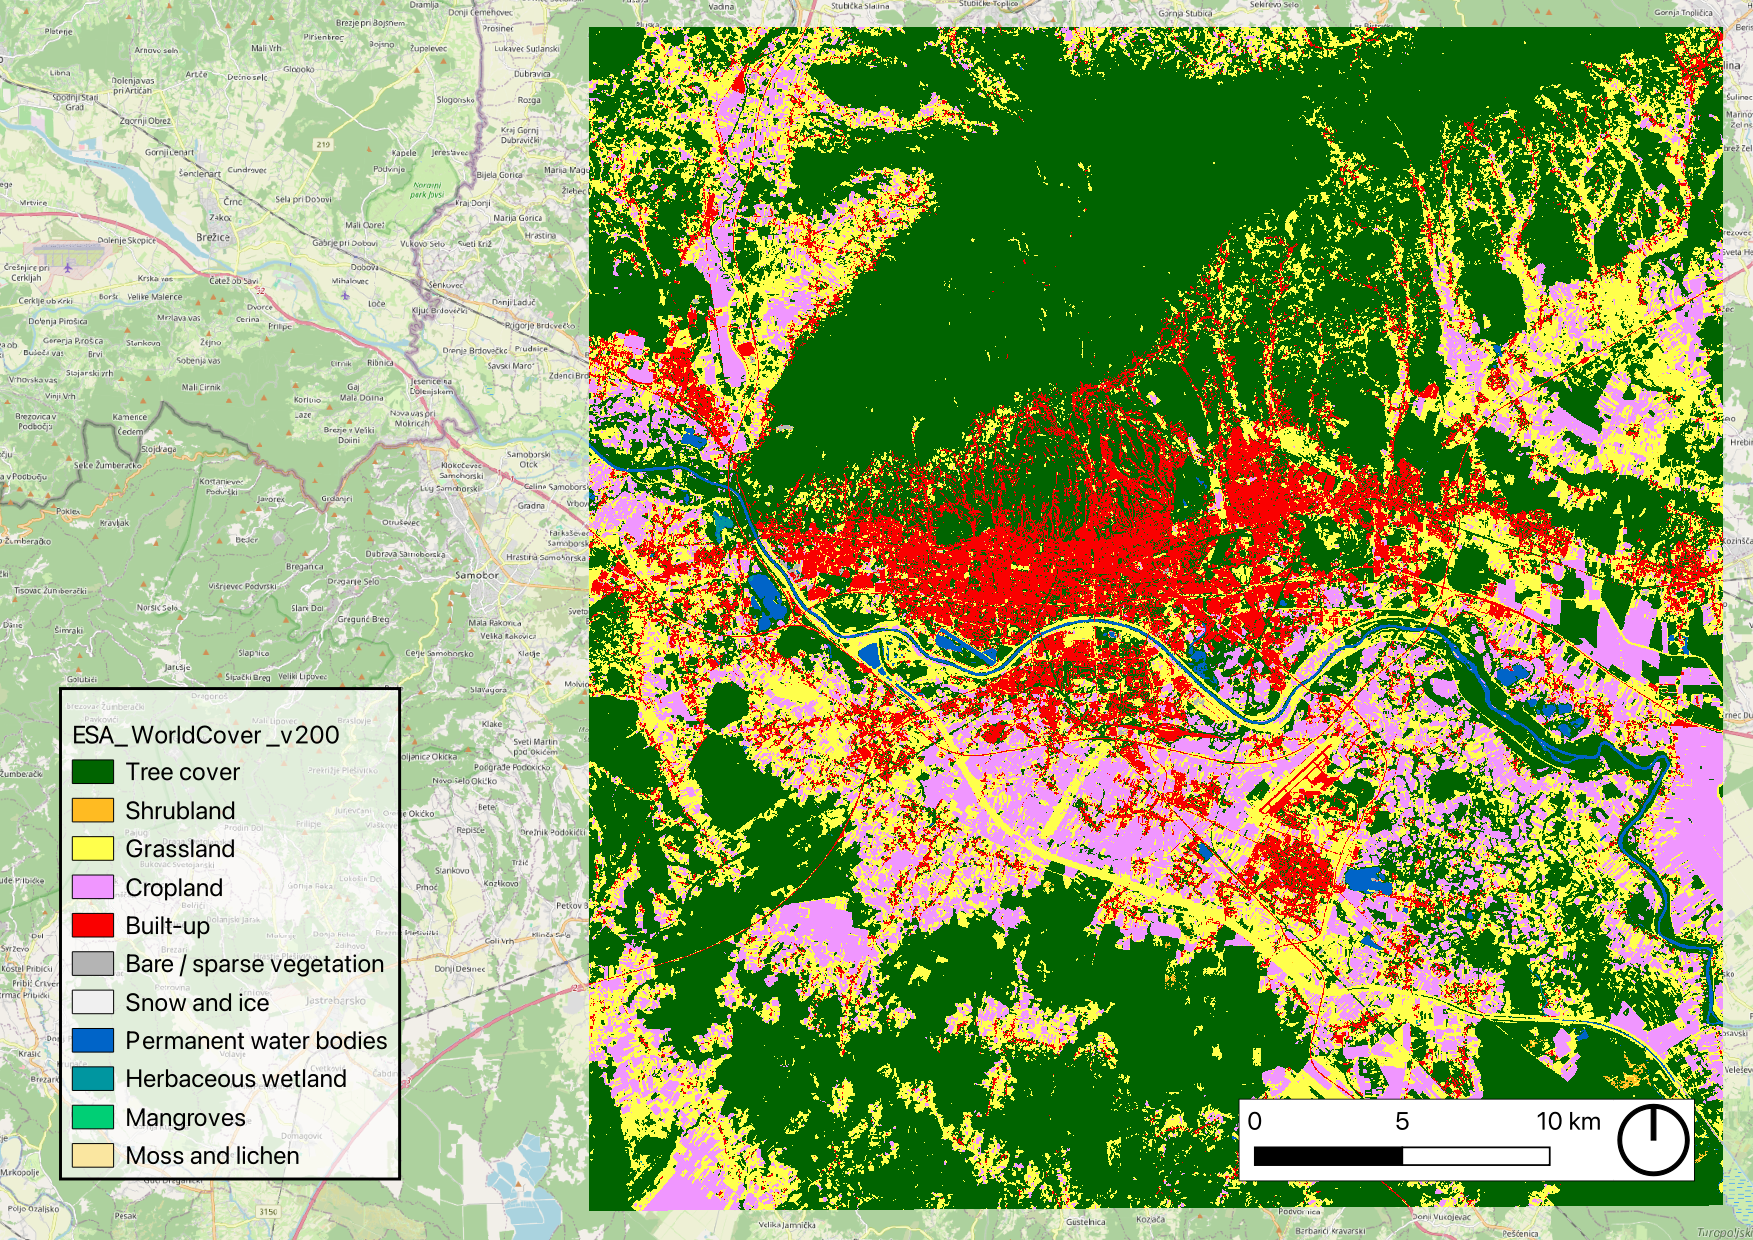
The Vegetation Fraction was computed using the land cover dataset obtained from ESA WorldCover v200. The dataset was processed by reclassifying individual pixels based on their land use categories. A moving window averaging algorithm was applied with the
following vegetation fraction parameters:
- 1.00 – Tree cover (10), Shrubland (20), Grassland (30), Mangroves (95)
- 0.60 – Cropland (40)
- 0.50 – Herbaceous wetland (90), Moss and lichen (100)
- 0.10 – Bare/sparse vegetation (60)
- 0.05 – Built-up areas (50)
- 0.00 – Snow and ice (70), Permanent water bodies (80)
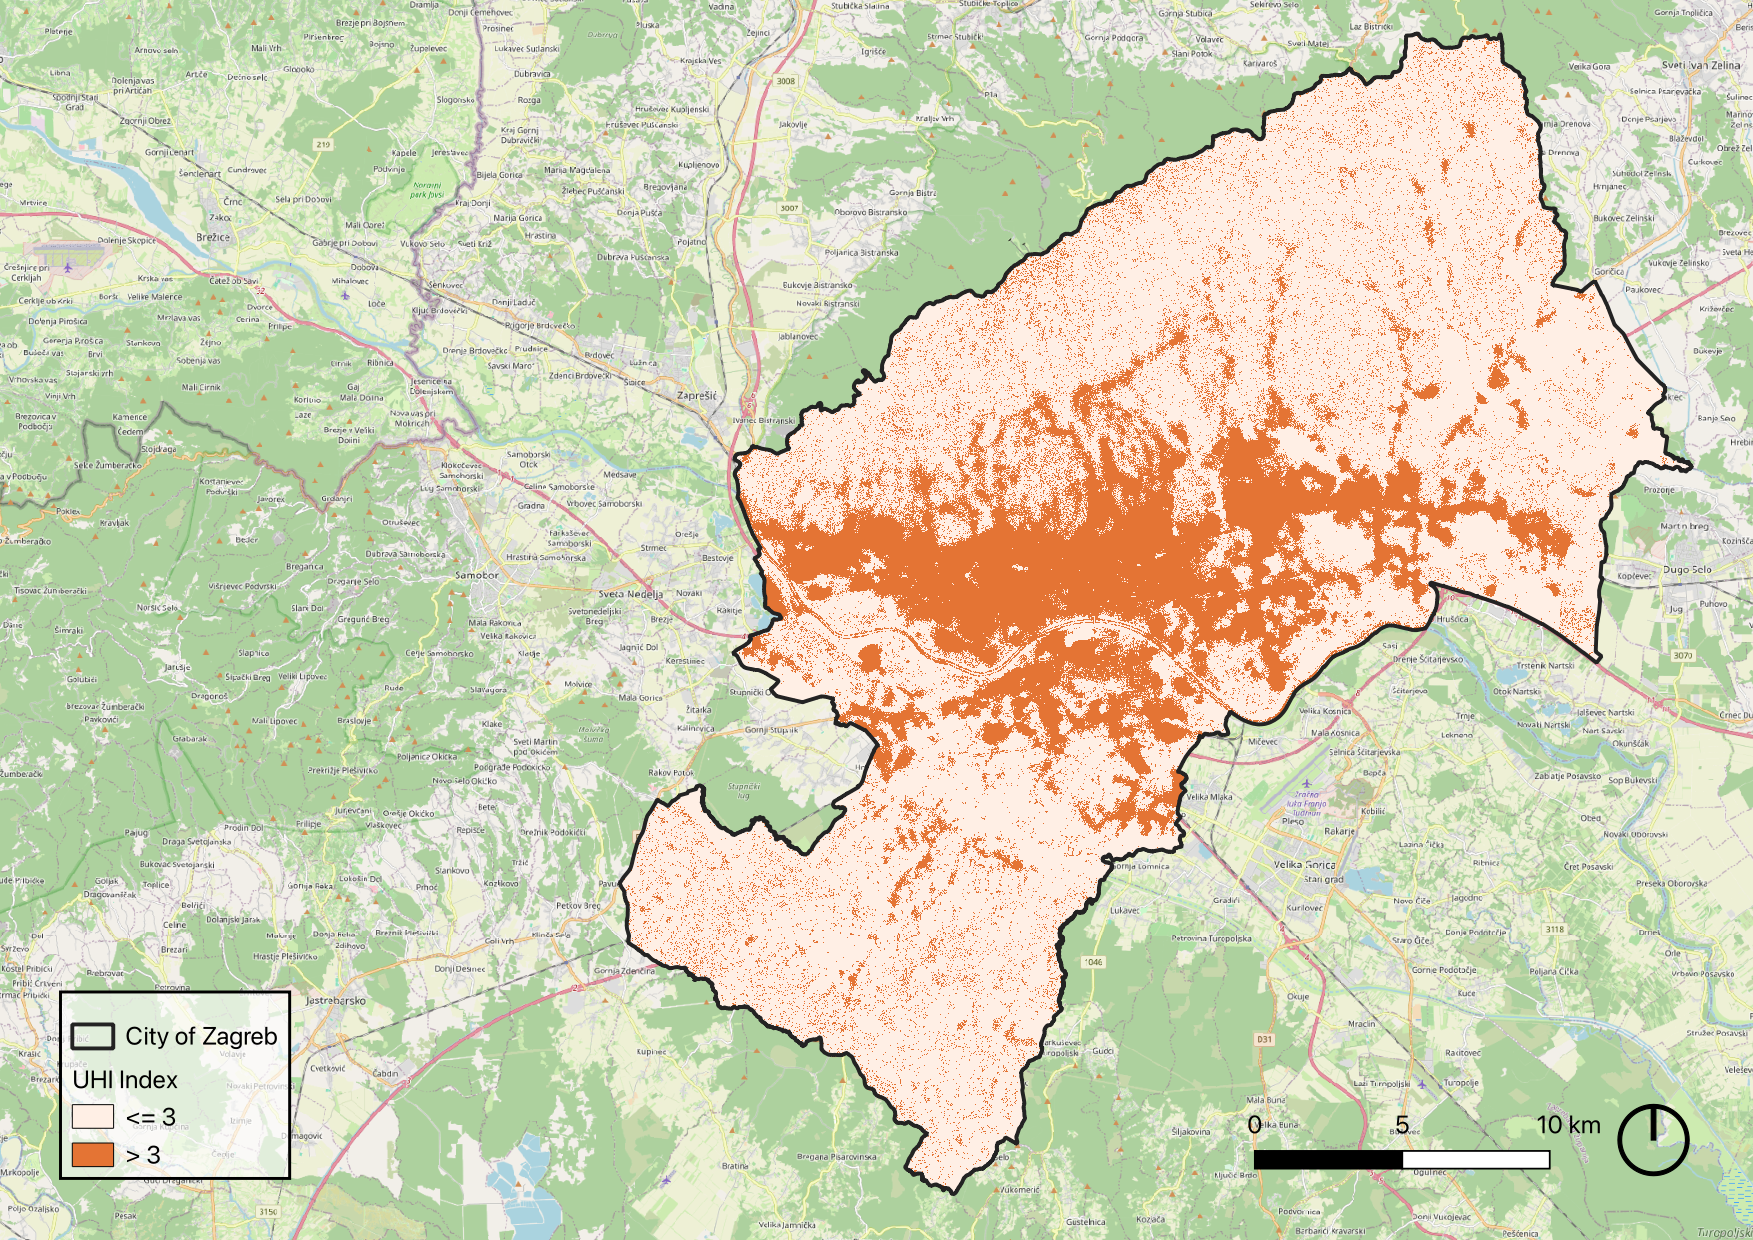
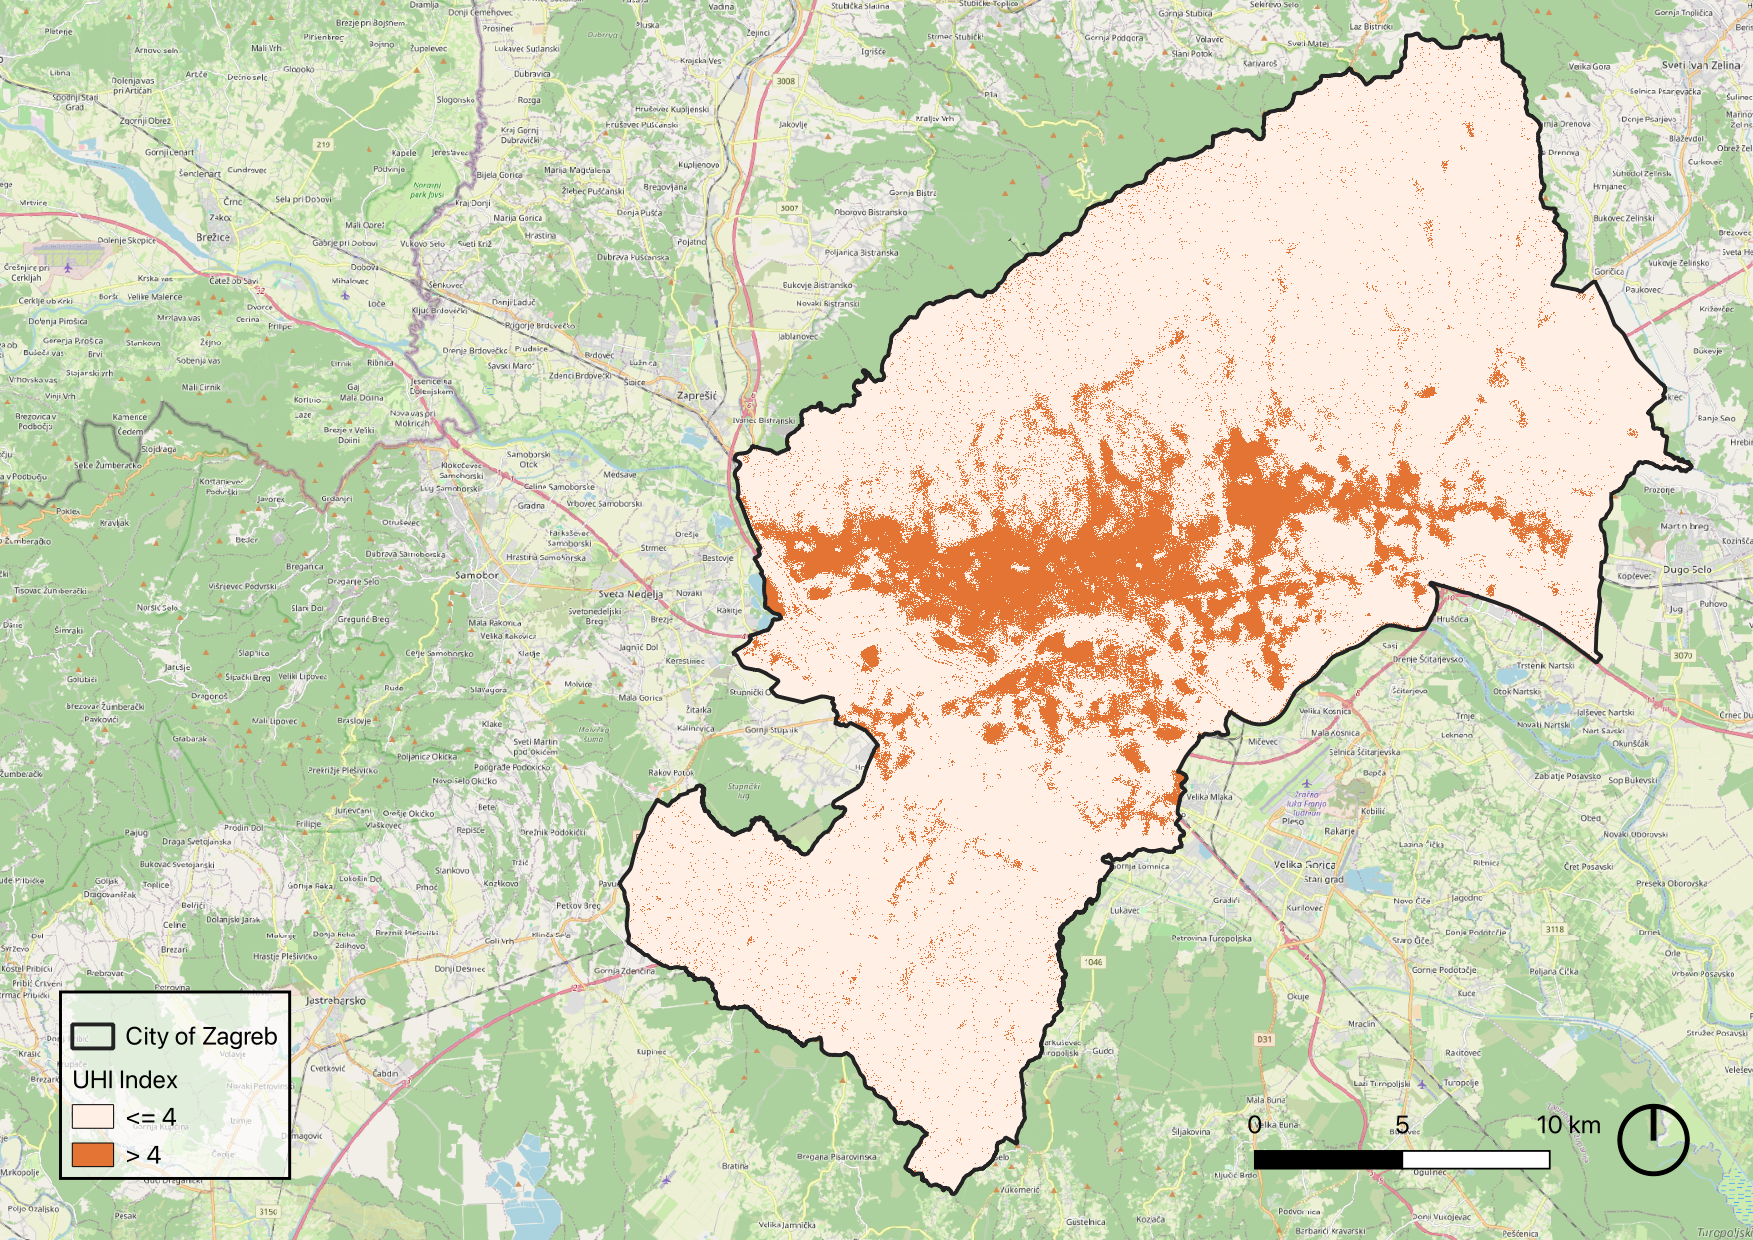
Urban Heat Island Index (UHI_max)
Info
The "UHI_max" index refers to the maximum Urban Heat Island intensity measured or modeled for a specific location. It represents the greatest temperature difference between an urban area and its surrounding rural reference area.
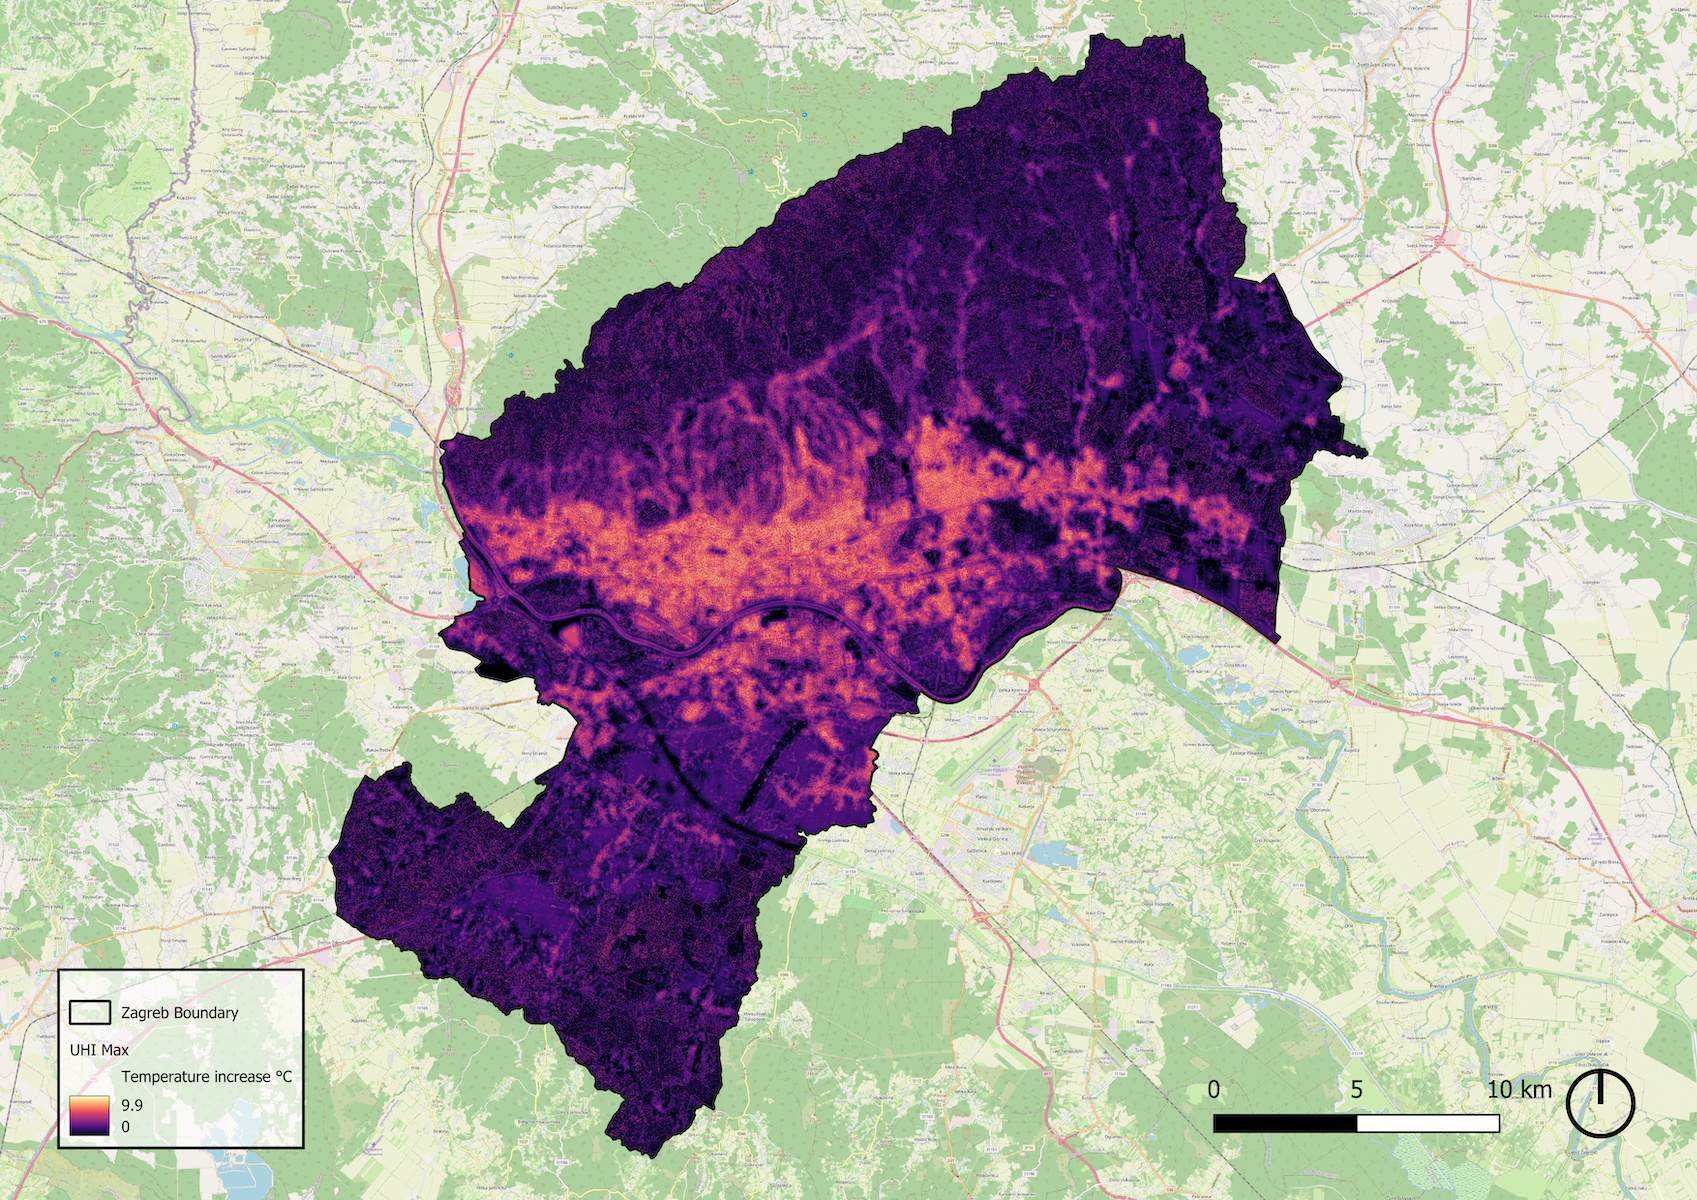
Urban Heat Island Index (UHI_max) with thresholds
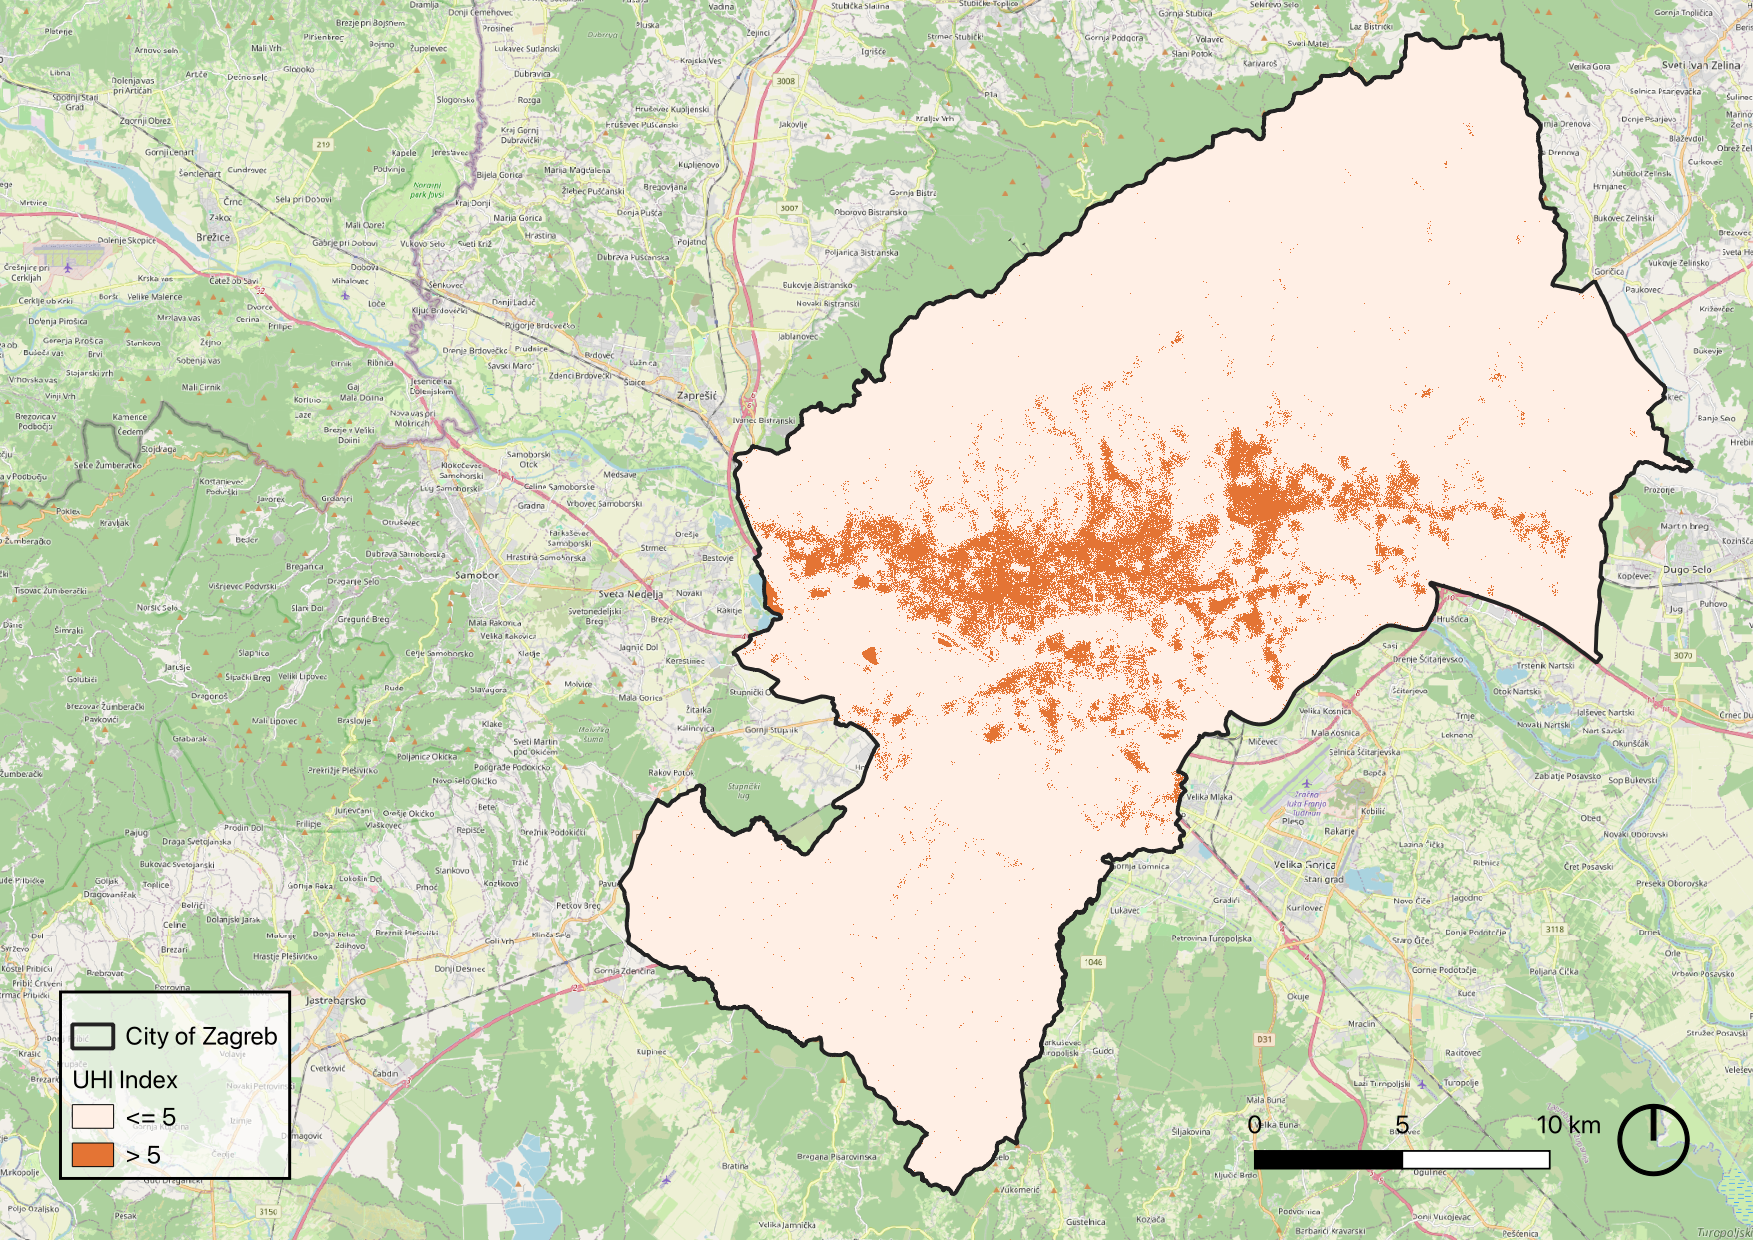
Final Product: lantable area for trees according to UHI mitigation principles
Based on the results of the UHImax calculation and a set of predefined selection criteria, we created a map identifying potential intervention sites for tree planting.
Info
This selection aligns with UHI mitigation strategies and the EU’s 3 Billion Trees by 2030 initiative. To maximize impact while avoiding disruption to existing infrastructure, the following criteria were applied when selecting suitable locations:
- Does not intersect existing trees,
- Does not intersect water bodies, swamps, or ice-covered areas,
- UHI Index greater than 4,
- Not classified as a building,
- Not located on roads or railway infrastructure.

")